Section 5 Calibration and Validation
After processing all of the data, the model was fitted using jags. The observation dataset was split into 80% for calibration, 20% for validation.
5.1 Parameter Estimates
5.1.1 Fixed Effects
Figure 5.1 and Table 5.1 present the estimated mean and 95% credible region interval (CRI) of each fixed effect parameter. The intercept term is not shown in the figure because the values are much larger than the other parameters, and would thus skew the scale.
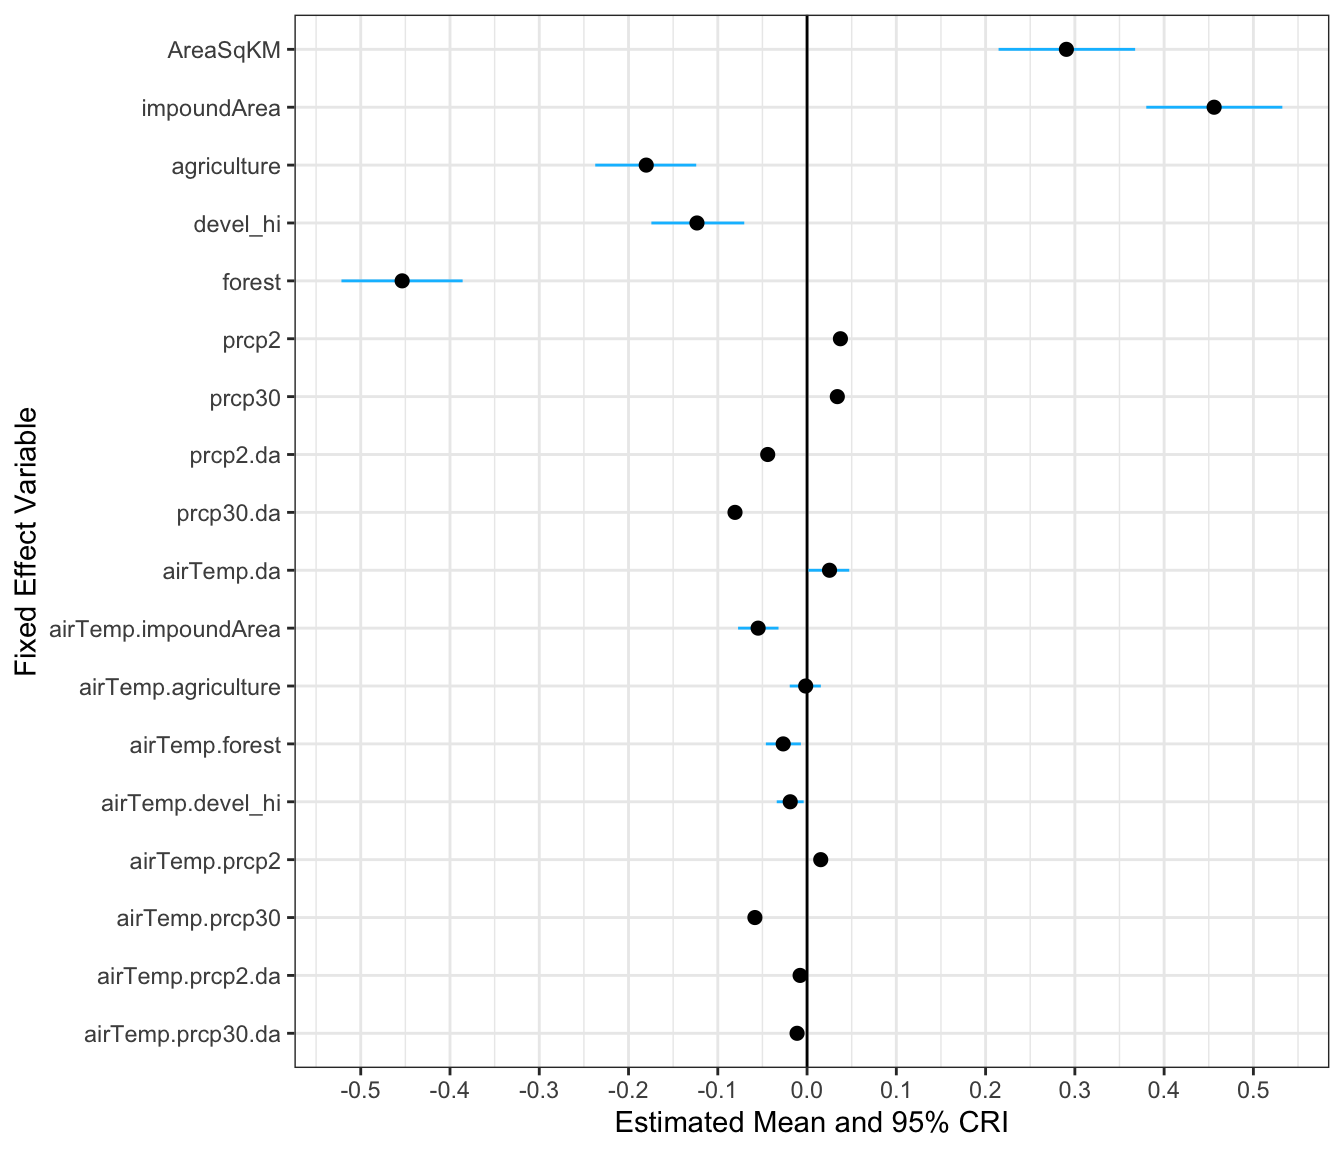
Figure 5.1: Estimated Mean and 95% CRI of Fixed Effects
| Variable | Mean | Lower CRI | Upper CRI |
|---|---|---|---|
| intercept | 16.831668438 | 16.682524667 | 16.975449785 |
| AreaSqKM | 0.290520111 | 0.214532987 | 0.367534804 |
| impoundArea | 0.456016628 | 0.380017105 | 0.532435569 |
| agriculture | -0.180179569 | -0.237304212 | -0.124162093 |
| devel_hi | -0.123342802 | -0.174409953 | -0.070354748 |
| forest | -0.453606158 | -0.521601617 | -0.385848596 |
| prcp2 | 0.037368478 | 0.035442637 | 0.039230802 |
| prcp30 | 0.033889432 | 0.027601220 | 0.039870142 |
| prcp2.da | -0.044082207 | -0.045919083 | -0.042220414 |
| prcp30.da | -0.080723453 | -0.086901209 | -0.074180702 |
| airTemp.da | 0.025152719 | 0.001480242 | 0.047233232 |
| airTemp.impoundArea | -0.054816312 | -0.077282009 | -0.031984213 |
| airTemp.agriculture | -0.001544660 | -0.019411269 | 0.015453974 |
| airTemp.forest | -0.026747107 | -0.046134745 | -0.006951219 |
| airTemp.devel_hi | -0.018879464 | -0.033975352 | -0.003815090 |
| airTemp.prcp2 | 0.015308325 | 0.013553468 | 0.017116532 |
| airTemp.prcp30 | -0.058429824 | -0.061922872 | -0.054993205 |
| airTemp.prcp2.da | -0.007801793 | -0.009506454 | -0.006054510 |
| airTemp.prcp30.da | -0.011195140 | -0.014792829 | -0.007682154 |
5.1.2 HUC8 Random Effects
Figure 5.2 shows the estimated mean and 95% credible region interval (CRI) for each random effect and HUC8. Table 5.2 lists the estimated mean and 95% CRI of each parameter averaged over all HUC8s (mean value with standard deviation in parentheses).
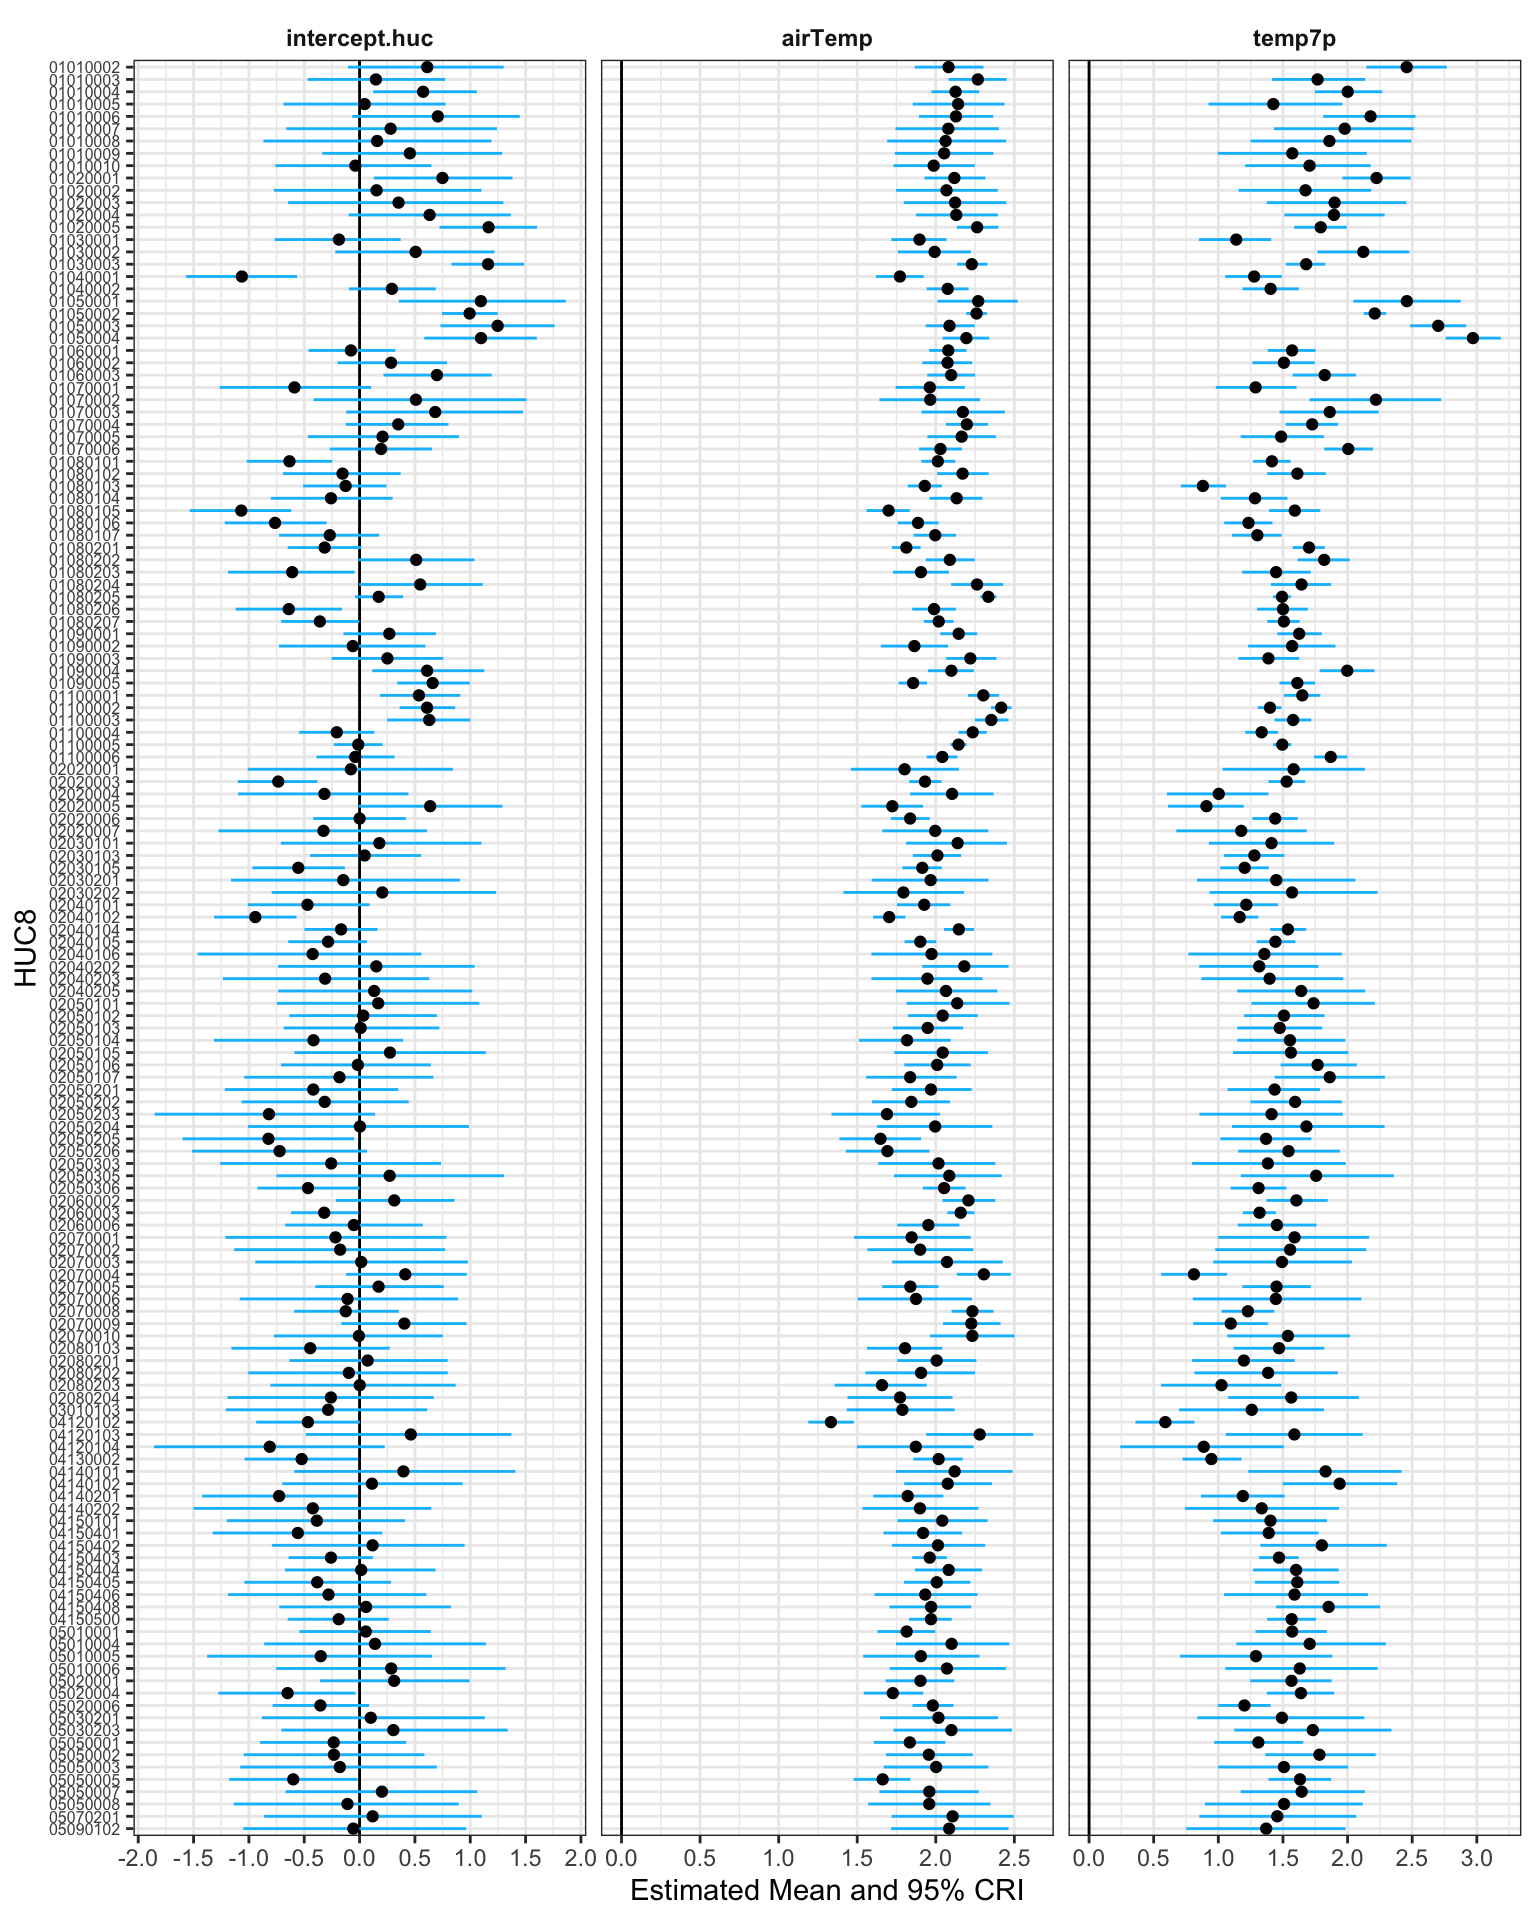
Figure 5.2: Estimated Mean and 95% CRI of HUC Random Effects for Each HUC8
| Variable | Count | Mean | Lower CRI | Upper CRI |
|---|---|---|---|---|
| intercept.huc | 144 | -0.001 (0.467) | -0.680 (0.538) | 0.677 (0.512) |
| airTemp | 144 | 2.009 (0.169) | 1.781 (0.210) | 2.236 (0.180) |
| temp7p | 144 | 1.552 (0.335) | 1.200 (0.371) | 1.906 (0.377) |
5.1.3 Catchment Random Effects
Figure 5.3 shows the distribution of the estimated mean for each random effect term over all catchments. CRIs are not shown due to the large number of individual catchments (8913). Table 5.3 lists the estimated mean and 95% CRI of each parameter averaged over all catchments (mean value with standard deviation in parentheses).
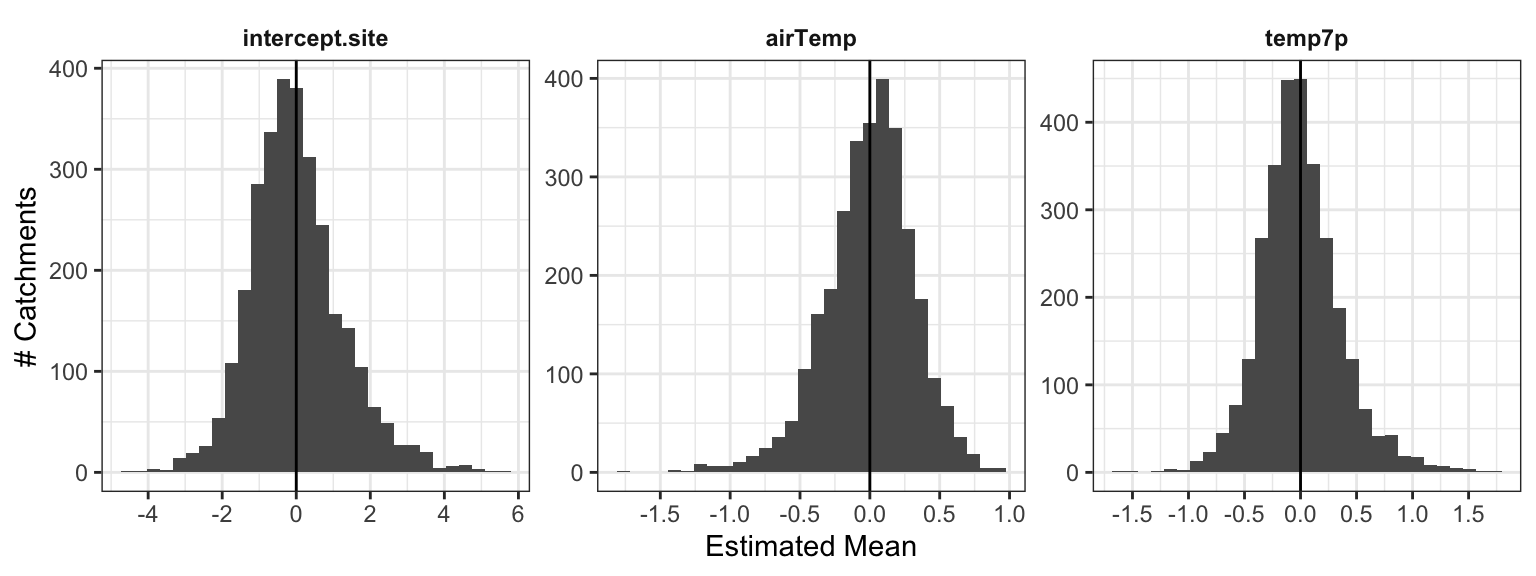
Figure 5.3: Distribution of estimated mean for each random effect over all catchments
| Variable | Count | Mean | Lower CRI | Upper CRI |
|---|---|---|---|---|
| intercept.site | 2,971 | -0.000 (1.254) | -0.721 (1.267) | 0.721 (1.281) |
| airTemp | 2,971 | 0.000 (0.319) | -0.283 (0.331) | 0.283 (0.336) |
| temp7p | 2,971 | -0.000 (0.366) | -0.500 (0.433) | 0.499 (0.370) |
5.1.4 Year Random Effects
Figure 5.4 and Table 5.4 present the mean and 95% CRI of the intercept term for each year. Recall that there are no random effects for years other than the intercept.
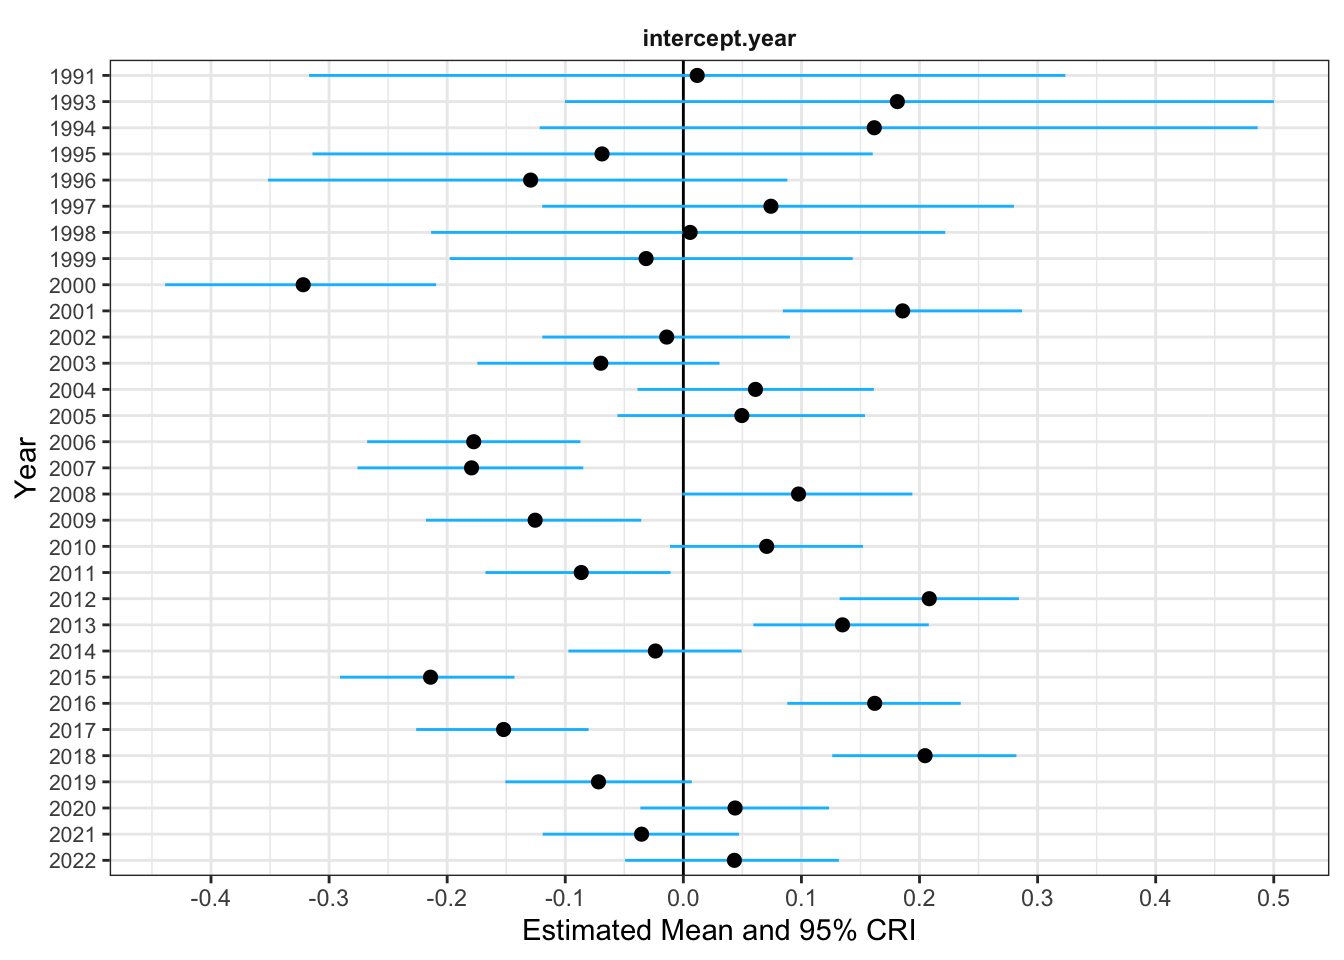
Figure 5.4: Estimated Mean and 95% CRI of Intercept Random Effect for Each Year
| Year | Mean | Lower CRI | Upper CRI |
|---|---|---|---|
| 1991 | 0.012 | -0.317 | 0.324 |
| 1993 | 0.181 | -0.100 | 0.500 |
| 1994 | 0.162 | -0.122 | 0.486 |
| 1995 | -0.069 | -0.314 | 0.160 |
| 1996 | -0.129 | -0.352 | 0.088 |
| 1997 | 0.074 | -0.119 | 0.280 |
| 1998 | 0.006 | -0.214 | 0.222 |
| 1999 | -0.032 | -0.198 | 0.143 |
| 2000 | -0.322 | -0.439 | -0.209 |
| 2001 | 0.186 | 0.084 | 0.287 |
| 2002 | -0.014 | -0.119 | 0.090 |
| 2003 | -0.070 | -0.174 | 0.031 |
| 2004 | 0.061 | -0.039 | 0.161 |
| 2005 | 0.050 | -0.056 | 0.154 |
| 2006 | -0.178 | -0.268 | -0.087 |
| 2007 | -0.179 | -0.276 | -0.085 |
| 2008 | 0.098 | -0.001 | 0.194 |
| 2009 | -0.126 | -0.218 | -0.036 |
| 2010 | 0.071 | -0.011 | 0.152 |
| 2011 | -0.086 | -0.168 | -0.011 |
| 2012 | 0.208 | 0.132 | 0.284 |
| 2013 | 0.135 | 0.059 | 0.208 |
| 2014 | -0.024 | -0.097 | 0.049 |
| 2015 | -0.214 | -0.291 | -0.143 |
| 2016 | 0.162 | 0.088 | 0.235 |
| 2017 | -0.152 | -0.226 | -0.080 |
| 2018 | 0.205 | 0.126 | 0.282 |
| 2019 | -0.072 | -0.151 | 0.007 |
| 2020 | 0.044 | -0.036 | 0.123 |
| 2021 | -0.035 | -0.119 | 0.047 |
| 2022 | 0.043 | -0.049 | 0.132 |
5.2 Goodness-of-Fit
Table 5.5 summarizes the model goodness-of-fit for all observations in the calibration and validation datasets.
| Calibration | Validation | |
|---|---|---|
| # Daily Observations | 705,509 | 80,035 |
| # Time Series | 7,814 | 863 |
| # Catchments | 2,971 | 566 |
| # HUC8s | 144 | 109 |
| # Years | 31 | 27 |
| RMSE (degC) | 1.061 | 1.342 |
| Mean Residual (degC) | 0.061 | 0.079 |
| Median Residual (degC) | 0.075 | 0.062 |
| Mean Absolute Residual (degC) | 0.813 | 1.021 |
| Median Absolute Residual (degC) | 0.649 | 0.805 |
| Minimum Residual (degC) | -7.570 | -7.665 |
| 1st Percentile Residual (degC) | -2.674 | -3.225 |
| 99th Percentile Residual (degC) | 2.659 | 3.697 |
| Maximum Residual (degC) | 9.196 | 7.411 |
Figure 5.5 presents scatterplots of predicted vs. observed daily mean temperature for the calibration and validation datasets. The black line is the 1:1 line of equality. The red line is a linear regression trend line.
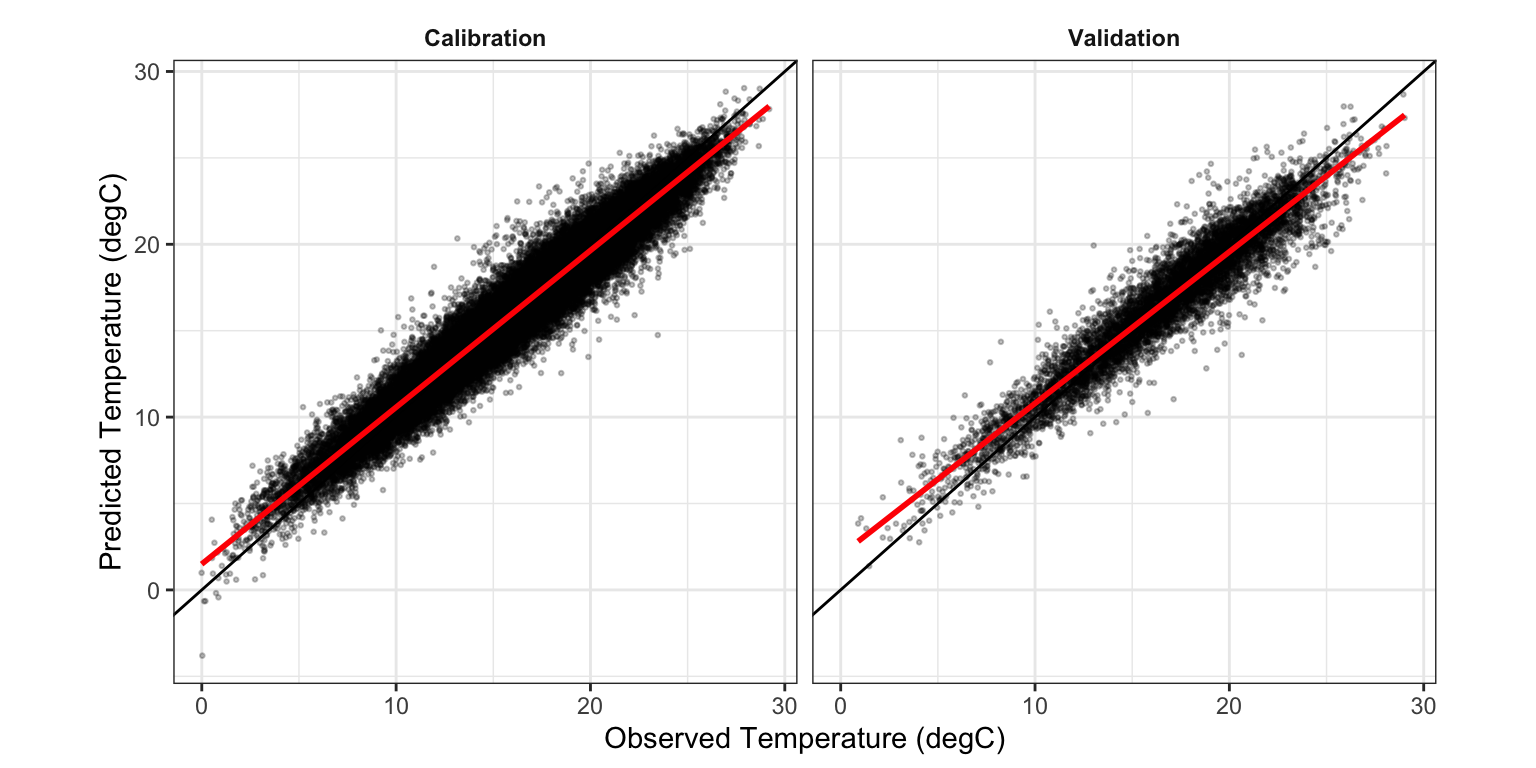
Figure 5.5: Predicted versus Observed Daily Mean Temperature (degC) for Calibration and Validation Datasets