Section 6 Predictions
Once calibrated, the model is used to generate stream temperature predictions for all catchments in the region having drainage areas less than 200 sq km and less than 70% open water coverage.
First, daily time series of predicted mean temperature are generated for each catchment. The daily predictions are then aggregated by year by calculated various metrics such as mean monthly temperatures and frequencies of exceeding various thresholds. Lastly, the annual temperature metrics are aggregated by catchment over all years in the historical period of record.
For each catchment, predictions are generated by the following steps:
- Calculate the predicted daily mean stream temperature for each year in the historical period of record (1980 - 2022) during the months of June, July and August
- For each month and year, calculate the following metrics:
- Mean monthly temperature (June, July, August)
- Mean and maximum summer temperature (June 1 - August 31)
- Maximum 30-day rolling mean temperature
- Number of days with temperature exceeding 18, 20, and 22 deg C
- Resistivity computed as the sum of the absolute difference between the predicted stream temperature and the daily mean air temperature (June 1 to August 31)
- For each catchment, the annual metrics from the previous step are aggregated by calculating the following metrics over all years:
- Mean monthly (June, July, August) and summer (June 1 - August 31) temperature
- Mean and maximum of the annual maximum summer temperature
- Mean of the annual maximum 30-dy rolling mean temperature
- Mean number of days per year exceeding 18, 20, and 22 deg C
- Mean resistivity
Figure 6.1 shows the distribution (histogram) of each final metric for all catchments.
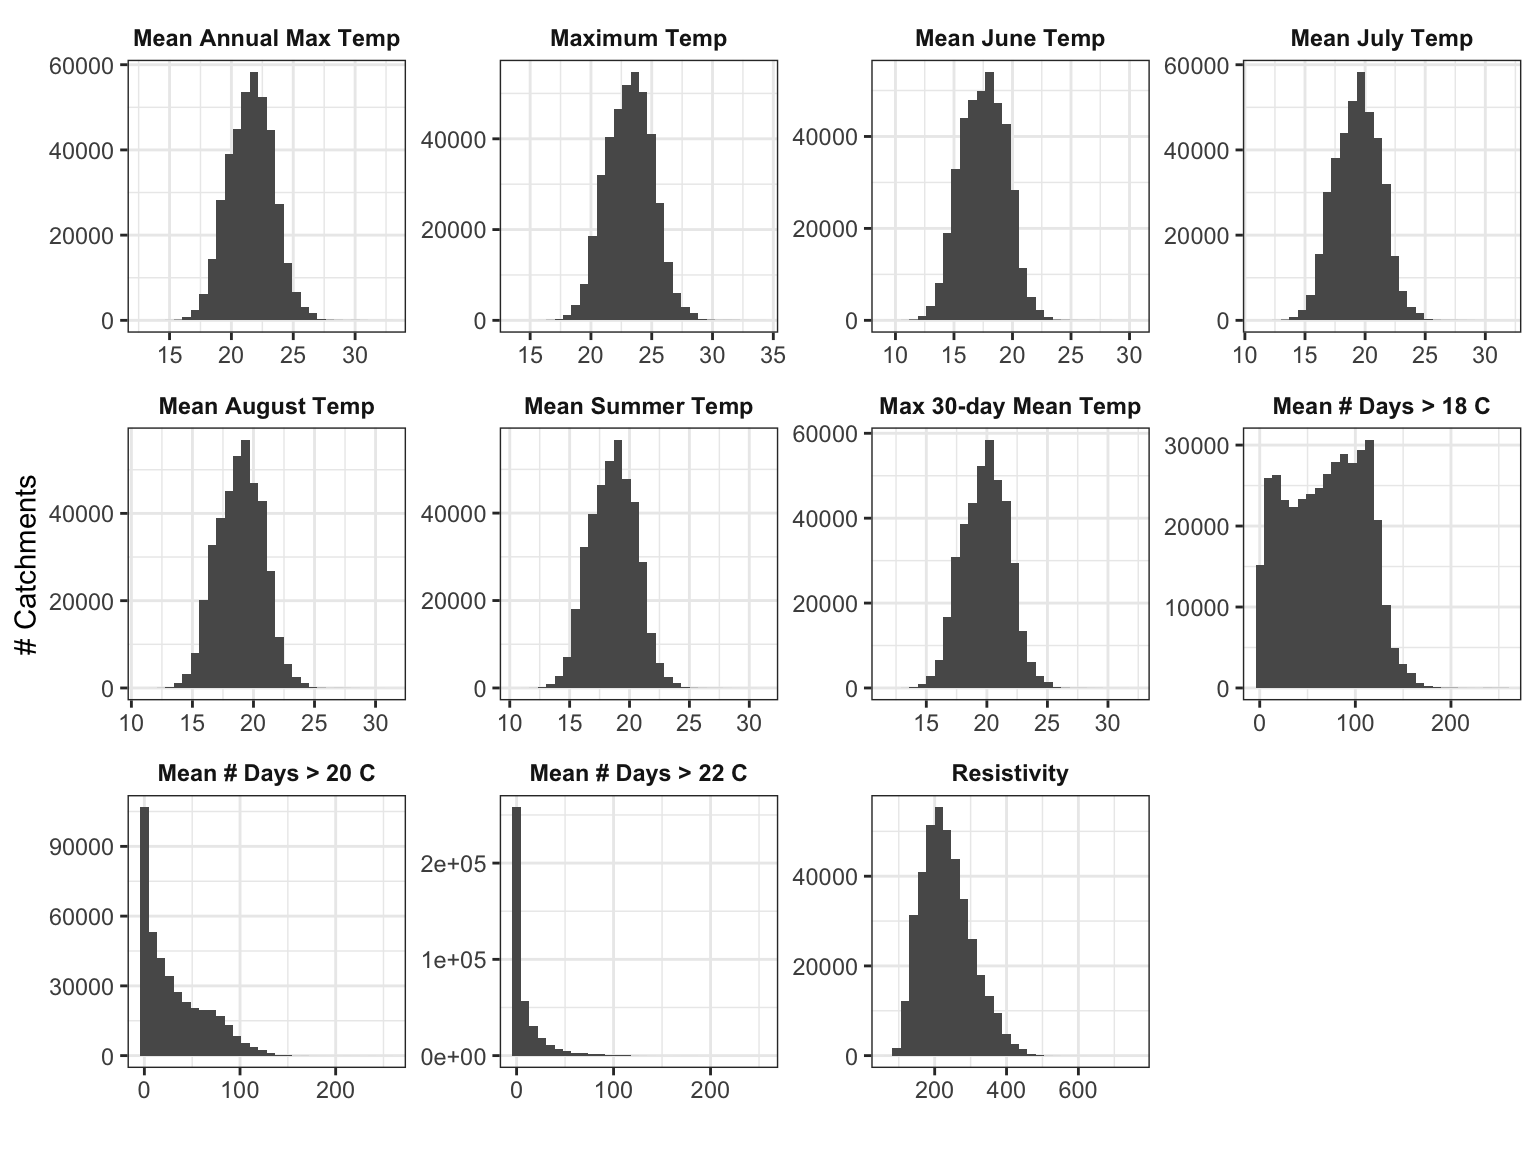
Figure 6.1: Distributions of Catchment Derived Metrics
6.1 Air Temperature Scenarios
Beginning with v1.1.1, the prediction metrics described above are generated for a series of climate change scenarios with air temperatures increasing by 2, 4, and 6 degC. These scenarios are calculated by increasing each daily air temperature by the respective amount. In other words, these scenarios assume a uniform increase in air temperature, which does not vary seasonally.
Figure 6.2 shows the distribution of mean July stream temperature among all catchments for each air temperature scenario.
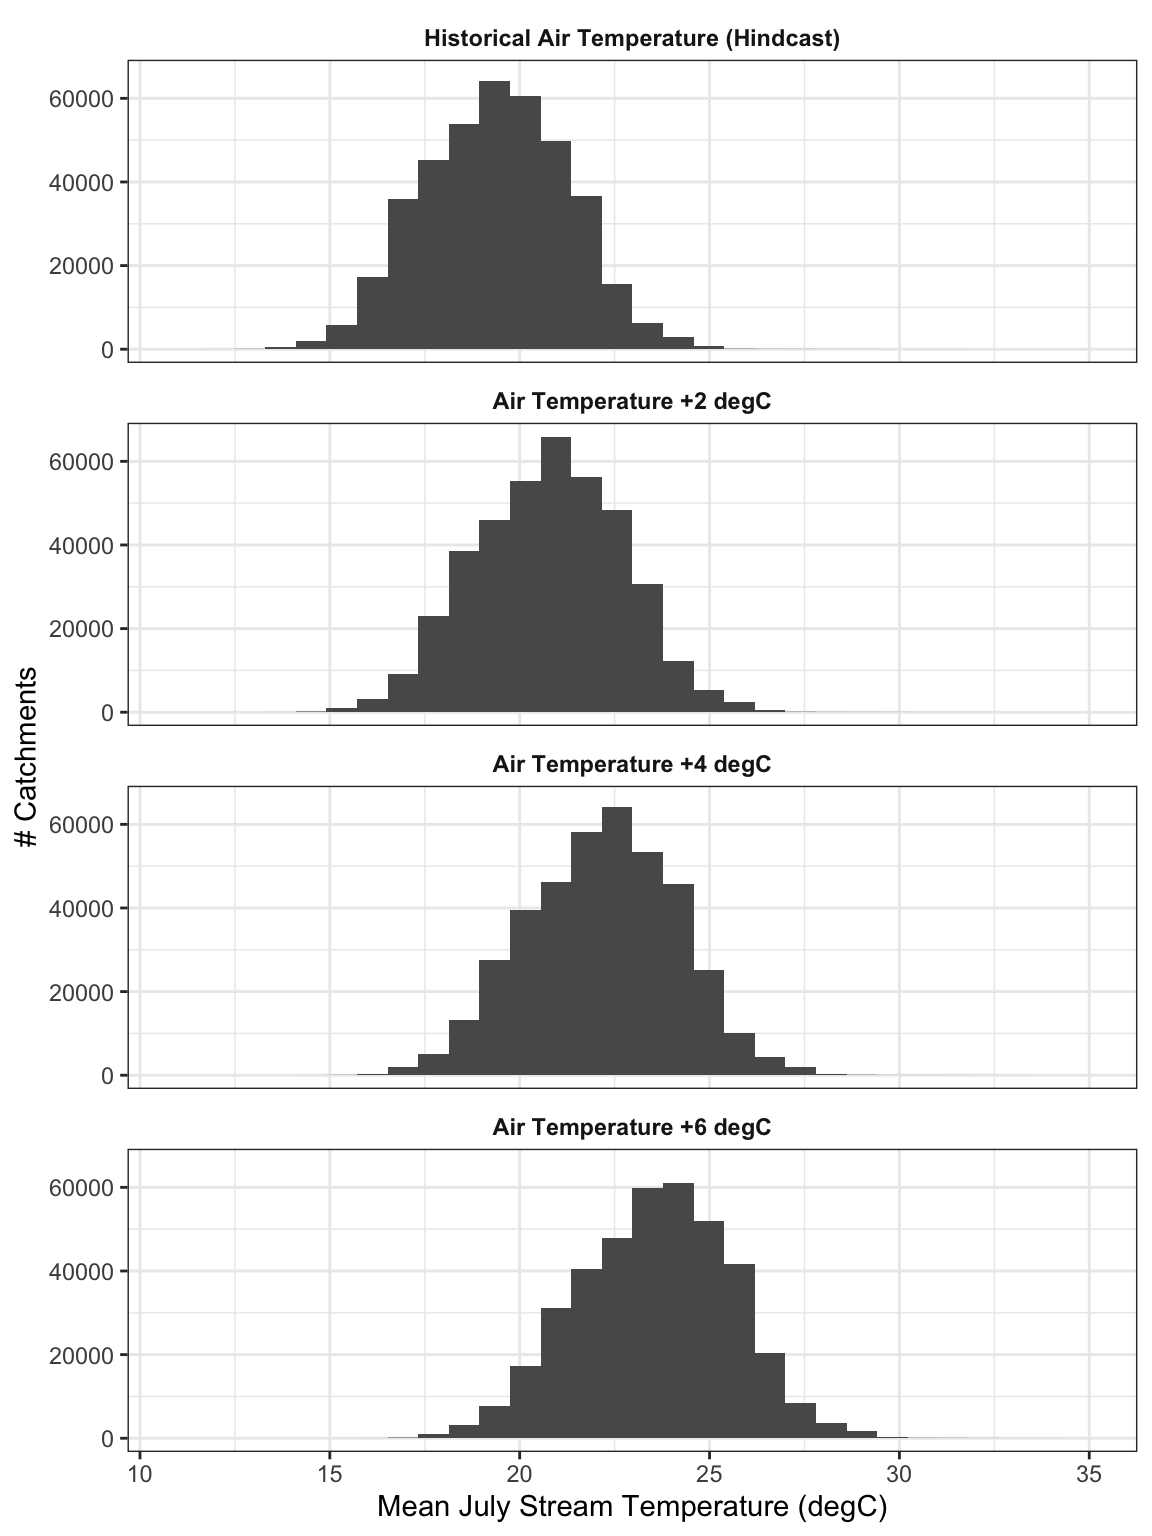
Figure 6.2: Distributions of Mean July Stream Temperature with Varying Air Temperature Increases