Section 4 Calibration and Validation
4.1 Dataset Split
To calibrate and validate the model, the observed dataset of presence/absence by catchment (see Observation Data) was randomly split using 80% of the catchments for calibration and 20% for validation.
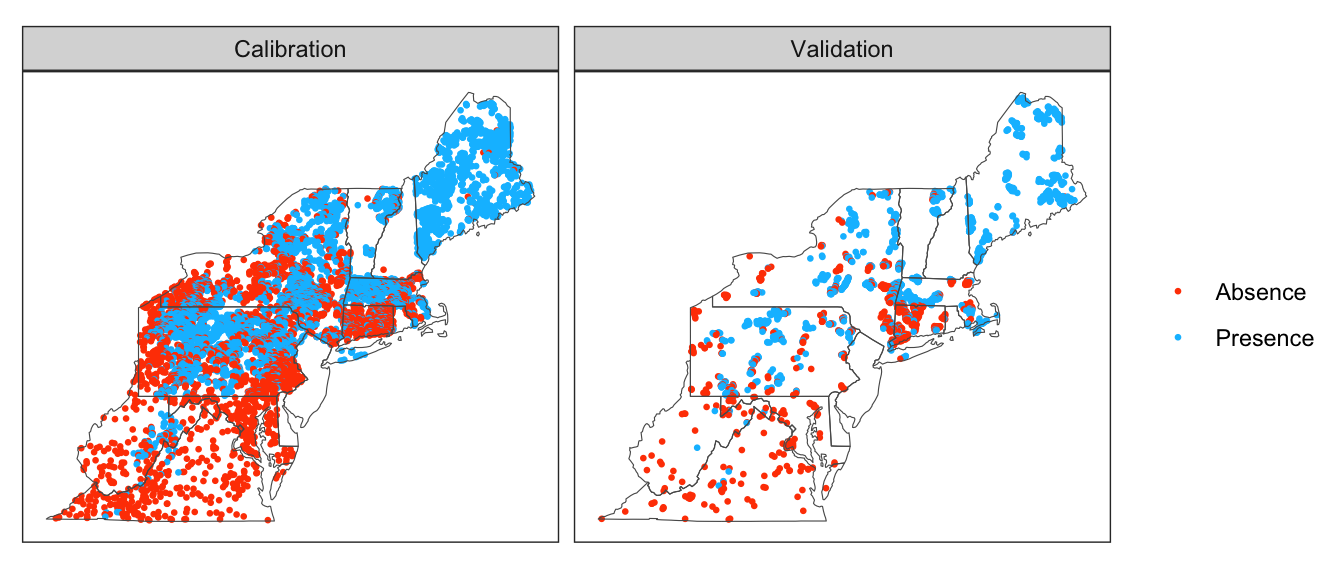
Figure 4.1: Calibration and Validation Splits
| Partition | Presence | Absense | Total | % Presence |
|---|---|---|---|---|
| Calibration | 6,690 | 3,612 | 10,302 | 64.9% |
| Validation | 1,822 | 1,017 | 2,839 | 64.2% |
| Total | 8,512 | 4,629 | 13,141 | 64.8% |
4.2 Calibration
The following output summarizes the fitted model using the calibration subset.
Generalized linear mixed model fit by maximum likelihood (Laplace
  Approximation) [glmerMod]
 Family: binomial  ( logit )
Formula: presence ~ mean_jul_temp + (1 | huc8)
   Data: model_gm_data
Control: glmerControl(optimizer = "bobyqa")

     AIC      BIC   logLik deviance df.resid
  8513.1   8535.0  -4253.5   8507.1    10934

Scaled residuals:
     Min       1Q   Median       3Q      Max
-17.9986  -0.3634   0.1320   0.4235  12.4987

Random effects:
 Groups Name        Variance Std.Dev.
 huc8   (Intercept) 5.139    2.267
Number of obs: 10937, groups:  huc8, 202

Fixed effects:
              Estimate Std. Error z value Pr(>|z|)
(Intercept)   20.66823    0.69572   29.71   <2e-16 ***
mean_jul_temp -1.08706    0.03498  -31.08   <2e-16 ***
---
Signif. codes:  0 '***' 0.001 '**' 0.01 '*' 0.05 '.' 0.1 ' ' 1

Correlation of Fixed Effects:
            (Intr)
mean_jl_tmp -0.966
The estimated fixed effect for mean July temp (mean_jul_temp) was -1.09. Because the estimated value is negative, the occupancy probability is higher at lower stream temperatures. Figure @(fig:calib-fixed) contains a marginal effects plot showing the predicted probability over varying mean July stream temperatures (excluding random effects).
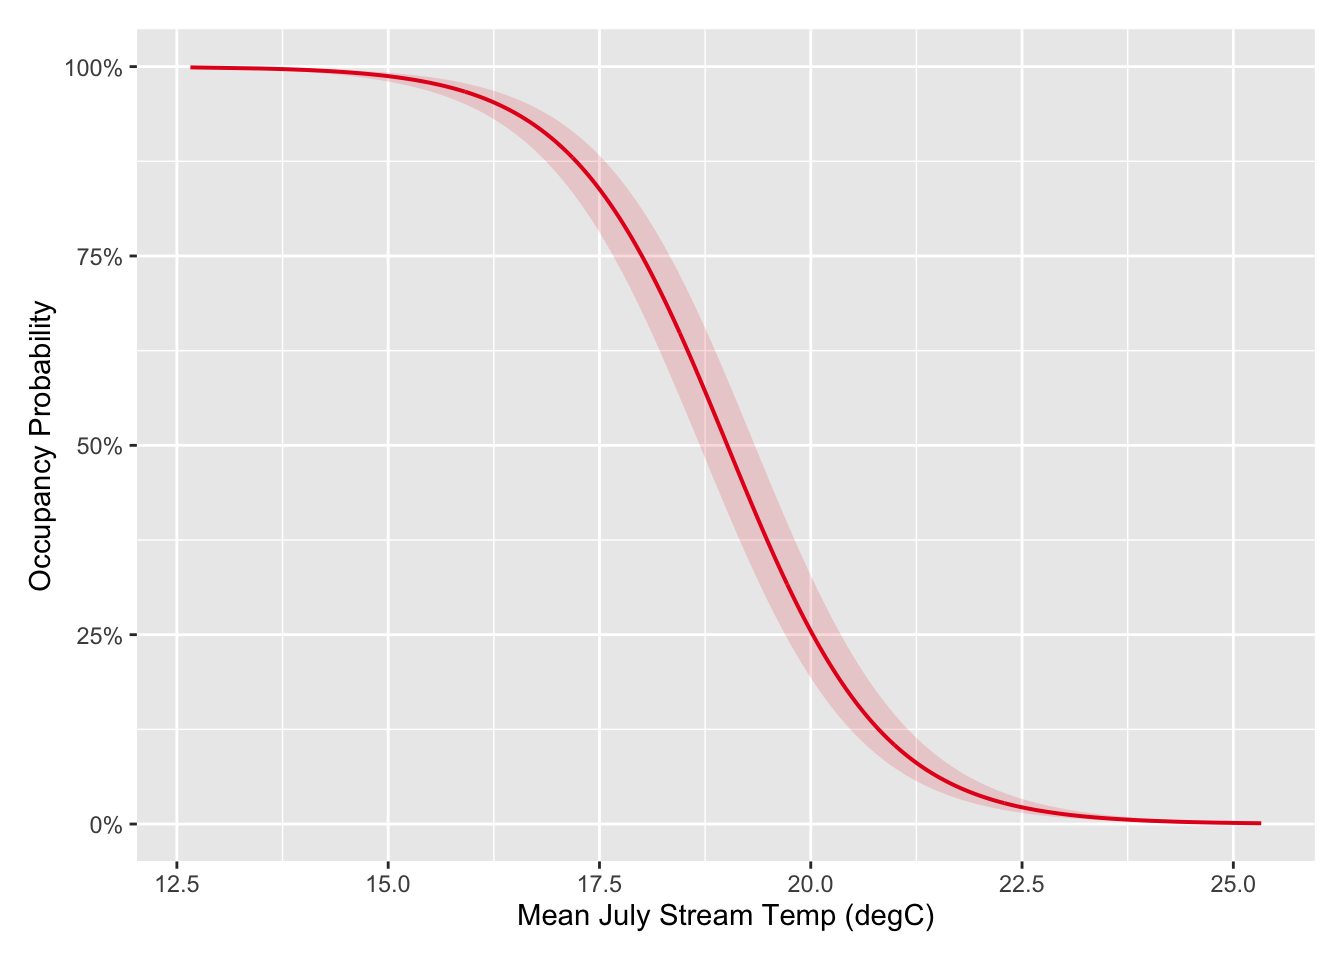
Figure 4.2: Marginal Effects Plot for Mean July Stream Temperature.
The random effect intercept varies by HUC8 basin. Basins with higher values tend to have higher occupancy probabilities for a given mean July stream temperature. Some HUC8 basins do not have an estimated value because there was no observations with the calibration dataset.
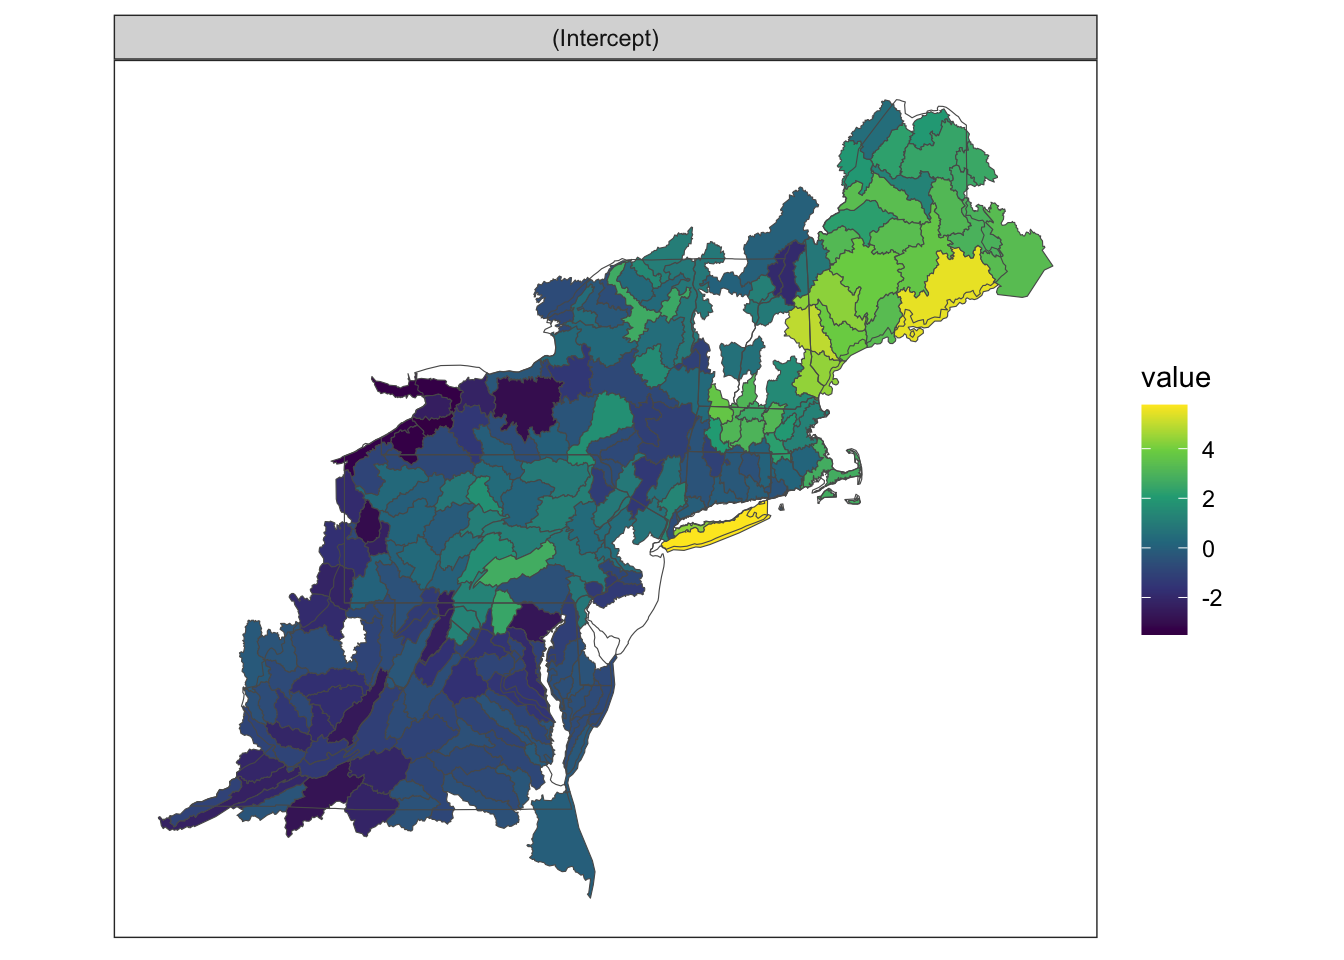
Figure 4.3: Random Effect Intercept by HUC8 Basin
The model accuracy and performance is summarized by a series of metrics computed from the confusion matrix, which contains the total number of true positives, true negatives, false positives, and false negatives. In the 2x2 table at the top of the following output, the columns (Reference) refer to the observed condition in each catchment (1 = presence, 0 = absence), while the rows (Prediction) refer to the predicted condition. The predicted probabilities were converted to presence/absence using a 50% cutoff. The remaining output provides a series of performance metrics computed from the confusion matrix using the confusionMatrix() of the caret package (Kuhn, 2022). See the help page for that function, as well as this Wikipedia article, for definitions of each metric.
Confusion Matrix and Statistics

          Reference
Prediction    0    1
         0 2766  720
         1 1074 6377

               Accuracy : 0.836
                 95% CI : (0.8289, 0.8429)
    No Information Rate : 0.6489
    P-Value [Acc > NIR] : < 2.2e-16

                  Kappa : 0.6322

 Mcnemar's Test P-Value : < 2.2e-16

            Sensitivity : 0.8985
            Specificity : 0.7203
         Pos Pred Value : 0.8559
         Neg Pred Value : 0.7935
             Prevalence : 0.6489
         Detection Rate : 0.5831
   Detection Prevalence : 0.6813
      Balanced Accuracy : 0.8094

       'Positive' Class : 1
4.3 Validation
Using the calibrated model, predicted probabilities were computed using the indendent validation dataset.
The confusion matrix for the validation dataset indicates slightly lower accuracy (0.84 vs 0.81), but overall comparable performance. These results suggest that the model does not suffer from overfitting.
Confusion Matrix and Statistics

          Reference
Prediction    0    1
         0  599  227
         1  190 1188

               Accuracy : 0.8108
                 95% CI : (0.7938, 0.827)
    No Information Rate : 0.642
    P-Value [Acc > NIR] : < 2e-16

                  Kappa : 0.5926

 Mcnemar's Test P-Value : 0.07791

            Sensitivity : 0.8396
            Specificity : 0.7592
         Pos Pred Value : 0.8621
         Neg Pred Value : 0.7252
             Prevalence : 0.6420
         Detection Rate : 0.5390
   Detection Prevalence : 0.6252
      Balanced Accuracy : 0.7994

       'Positive' Class : 1
The following table compares the performance metrics between the two subsets.
| Metric | Calibration | Validation |
|---|---|---|
| Accuracy | 0.836 | 0.811 |
| Sensitivity | 0.899 | 0.840 |
| Specificity | 0.720 | 0.759 |
| Pos Pred Value | 0.856 | 0.862 |
| Neg Pred Value | 0.793 | 0.725 |
| Precision | 0.856 | 0.862 |
| Recall | 0.899 | 0.840 |
| F1 | 0.877 | 0.851 |
| Prevalence | 0.649 | 0.642 |
| Detection Rate | 0.583 | 0.539 |
| Detection Prevalence | 0.681 | 0.625 |
| Balanced Accuracy | 0.809 | 0.799 |
Lastly, Receiver Operator Characteristic (ROC) curves and Area Under the Curve (AUC) values also shows comparable performance between the calibration and validation subsets.
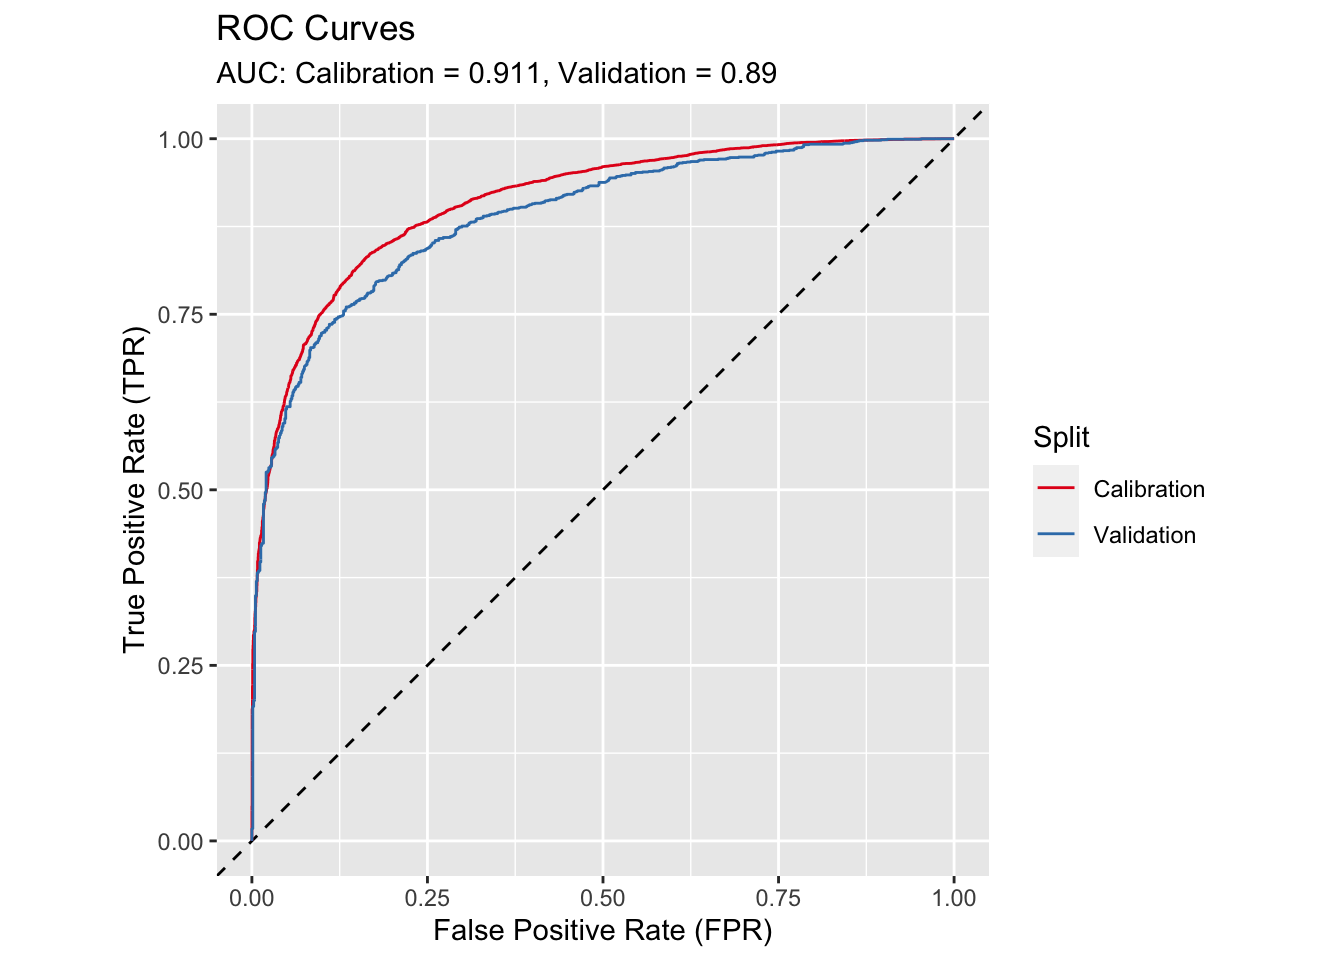
Figure 4.4: ROC Curves for Calibration and Validation