Section 2 Data Sources
2.1 Catchment Delineation
The model domain was based on the EcoSHEDS Northeast Catchment Delineation, which is also used for the EcoSHEDS Northeast Stream Temperature Model. This delineation was created in 2014-2015 to provide a high resolution catchment delineation across the northeast that was spatially consistent over the entire region. The EcoSHEDS delineation was created prior to the completion of the USGS NHDPlus High Resolution dataset. Unfortunately, the two delineations are not directly relatable.
Figure 2.1 shows the extent of this delineation, which covers the northeast and mid-Atlantic portions of the eastern U.S. from Maine to Virginia. The delineation includes approximately 450,000 individual catchments, with an mean surface area of 1.6 km2.
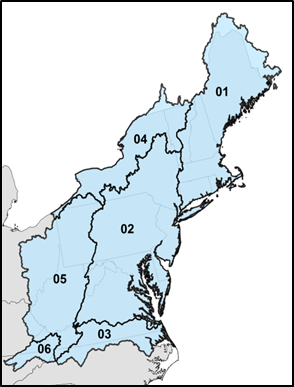
Figure 2.1: Hydrologic Regions of EcoSHEDS Northeast Catchment Delineation
2.2 HUC8 Basins
The 8-digit Hydrologic Unit Code (HUC8) basins were used to account for regional variations in brook trout occupancy that was not explained by stream temperature data (see [Model Structure]). Figure 2.2 shows the boundary of each HUC8 basin.
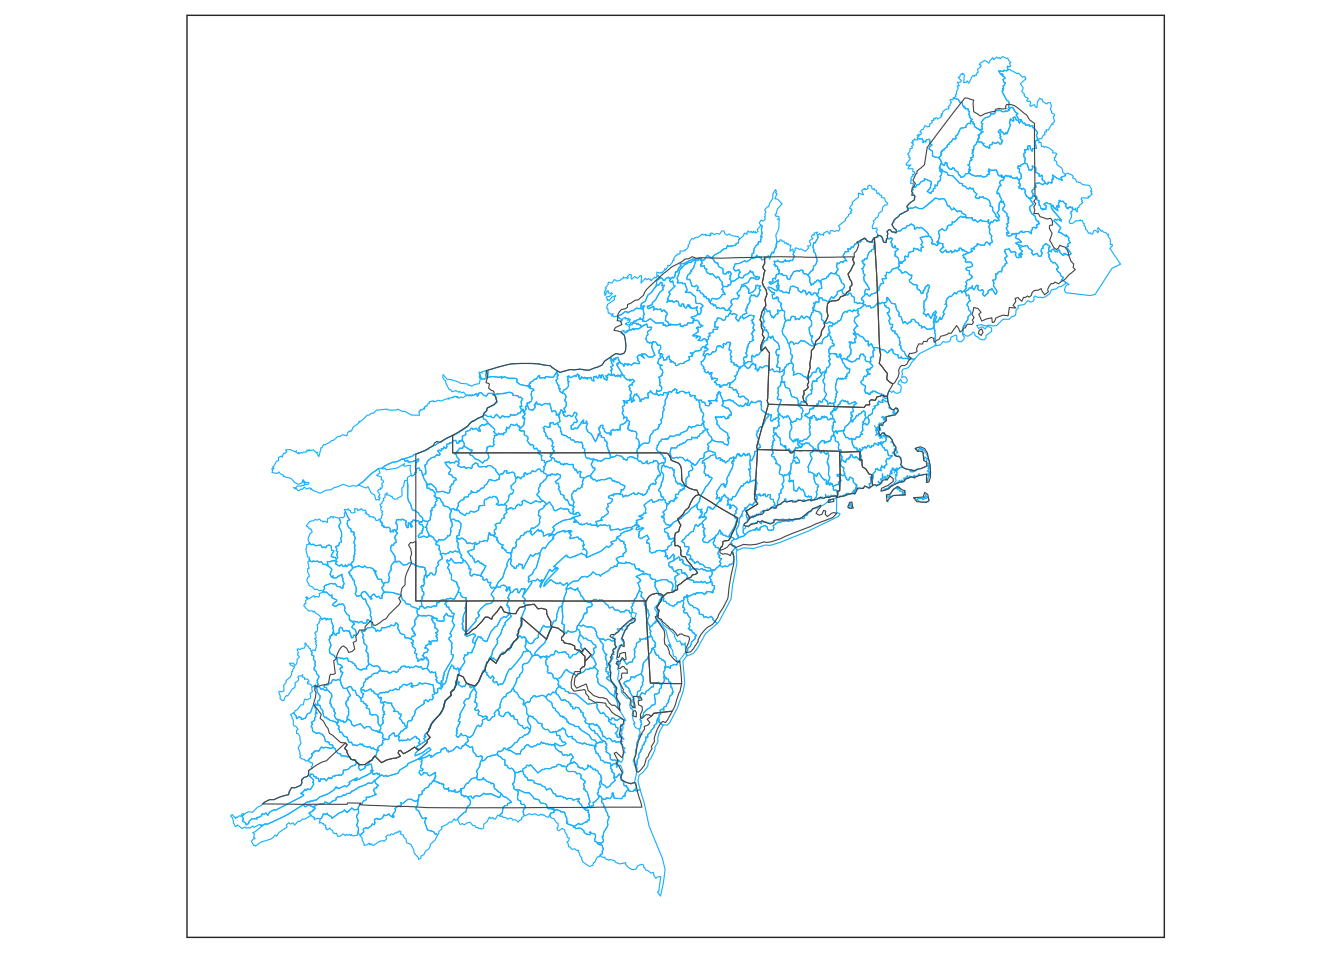
Figure 2.2: HUC8 Basins
2.3 Observation Data
Observed presence/absence data of eastern brook trout was gathered from multiple state agencies.
The raw presence/absence observations were aggregated by catchment for input to the model. If there were multiple observations in a single catchment (either at different locations or at different times), then the catchment was assigned to the presence category if there was at least presence among those observations. If all observations were absences, then the catchment was assigned to absence.
The follow map, figures, and table provide a summary of the observed catchment presence/absence by state.
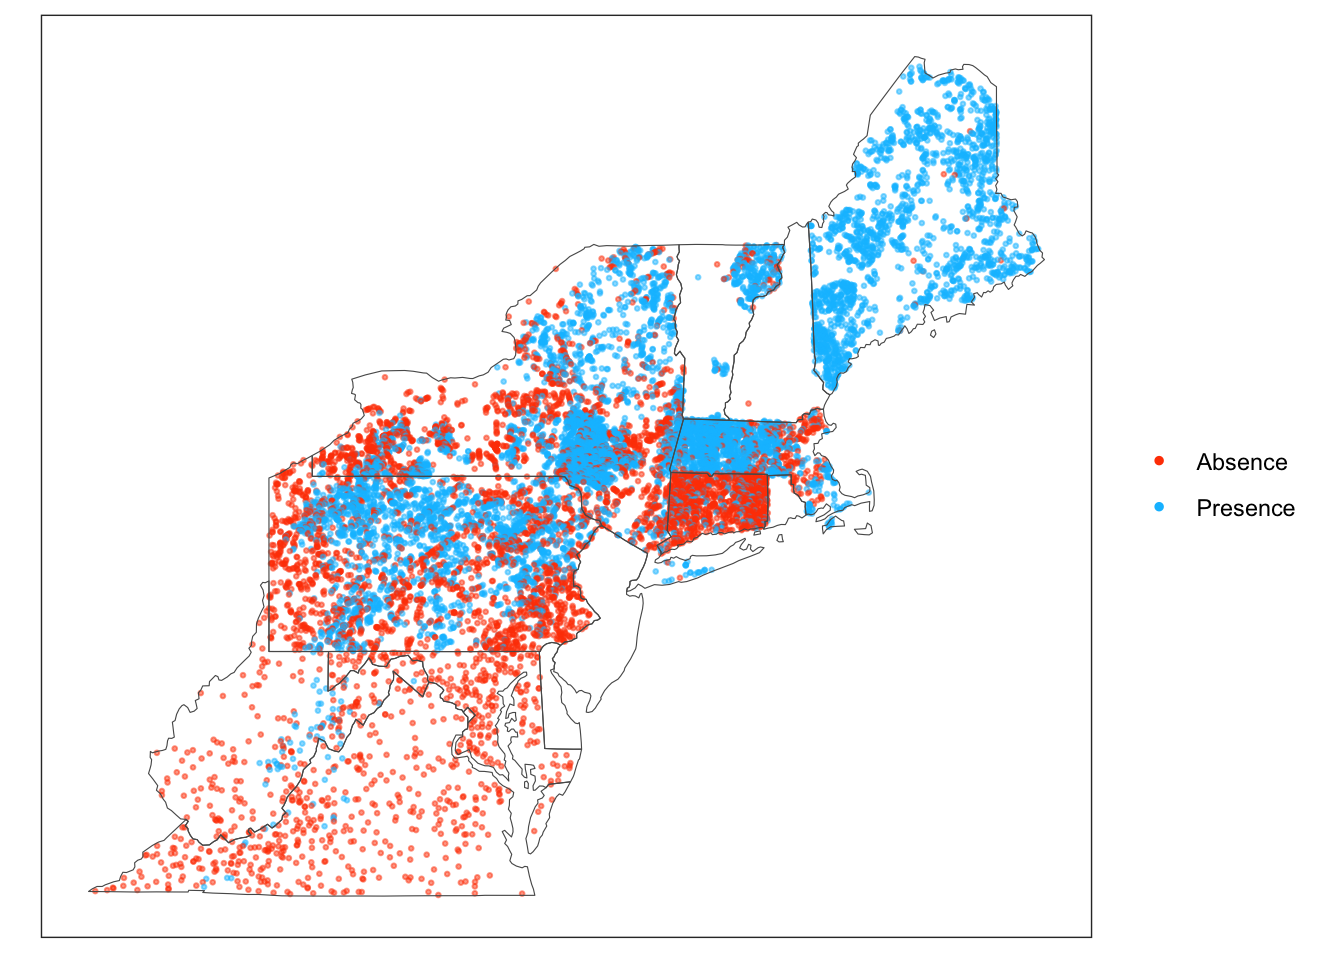
Figure 2.3: Map of Presence/Absence by Catchment
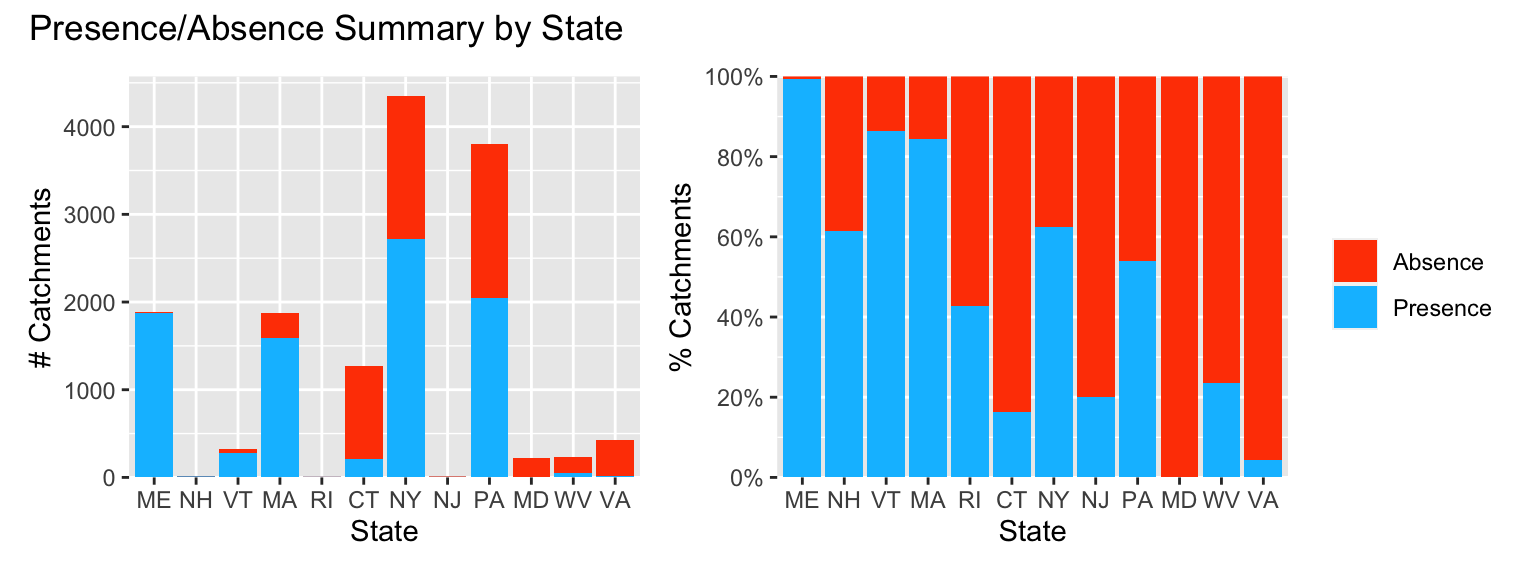
Figure 2.4: Presence/Absence Catchment Totals by State
| State | Presence | Absence | Total | % Presence |
|---|---|---|---|---|
| ME | 1,874 | 10 | 1,884 | 99.5% |
| NH | 8 | 5 | 13 | 61.5% |
| VT | 283 | 45 | 328 | 86.3% |
| MA | 1,585 | 294 | 1,879 | 84.4% |
| RI | 3 | 4 | 7 | 42.9% |
| CT | 206 | 1,066 | 1,272 | 16.2% |
| NY | 2,722 | 1,633 | 4,355 | 62.5% |
| NJ | 2 | 8 | 10 | 20.0% |
| PA | 2,050 | 1,747 | 3,797 | 54.0% |
| MD | 0 | 226 | 226 | 0.0% |
| WV | 55 | 178 | 233 | 23.6% |
| VA | 18 | 404 | 422 | 4.3% |
| Total | 8,806 | 5,620 | 14,426 | 61.0% |
2.4 Stream Temperature
The primary input to the brook trout occupancy model is the estimated mean July stream temperature of each catchment. These estimates were generated using the EcoSHEDS Northeast Stream Temperature Model. The estimated value for each catchment represents the long-term mean July stream temperature computed over all years since 1980. Estimates are only generated for catchments with total cumulative drainage areas less than 200 km2 due to the great complexity, anthropogenic impacts, and non-linearities associated with temperature dynamics in larger rivers.
The stream temperature model is based on a linear mixed effects framework that accounts for spatial and temporal correlations using a hierachical Bayesian structure. The primary input variables include air temperature, precipitation, land use (forest, agriculture, high development), impounded drainage area, and total drainage area. See the EcoSHEDS Northeast Stream Temperature Model for more information.
Figure 2.5 shows the estimated mean July stream temperature for each catchment.
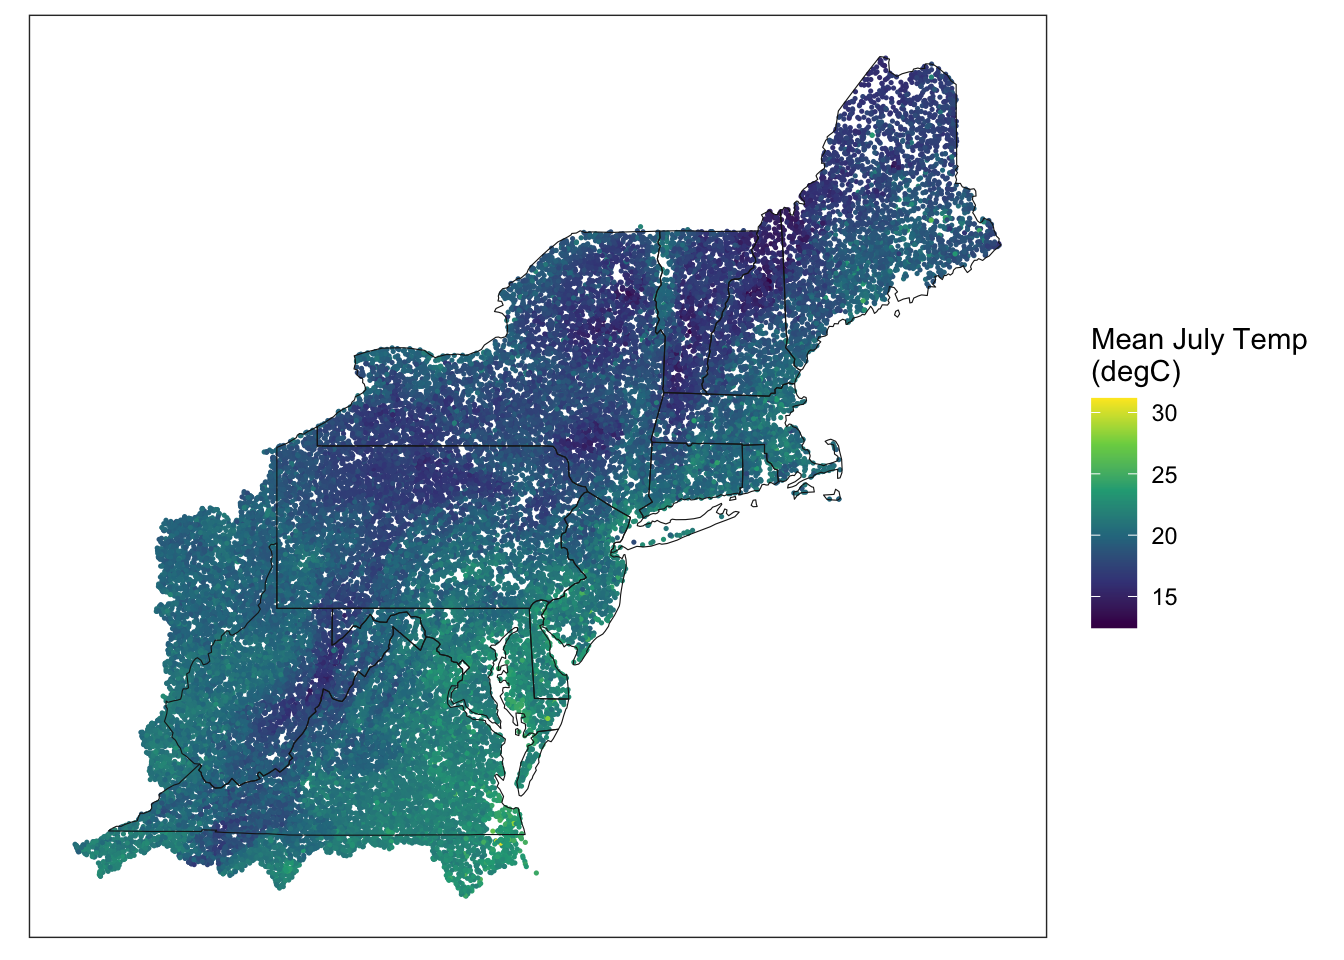
Figure 2.5: Estimated Mean July Stream Temperature by Catchment